Updating search results...

Search Resources

20 Results

View
Selected filters:
  • maps
Analyzing Correlations of Education and Income
Rating
0.0 stars

Students will explore maps containing census data from 1950 through 2000. They will analyze how education levels and median household incomes have changed over time and determine how the two might be correlated. Students will also come up with ideas for policies that could help address issues related to income and education.

Subject:
Cross-Curricular
Government and Civics
History/Social Sciences
Mathematics
Material Type:
Activity/Lab
Provider:
U.S. Census Bureau
Provider Set:
Statistics in Schools
Date Added:
01/06/2020
By Land, Sea or Air
Read the Fine Print
Educational Use
Rating
0.0 stars

In this lesson, students learn that navigational techniques change when people travel to different places land, sea, air and in space. For example, an explorer traveling by land uses different methods of navigation than a sailor or an astronaut.

Subject:
Science
Scientific and Engineering Practices
Material Type:
Activity/Lab
Lesson Plan
Provider:
TeachEngineering
Provider Set:
TeachEngineering
Author:
Denise Carlson
Denise W. Carlson
Malinda Schaefer Zarske
Matt Lippis
Penny Axelrad
Date Added:
09/18/2014
Developing Map Skills Through Earth Science Activities
Conditional Remix & Share Permitted
CC BY-SA
Rating
0.0 stars

This article highlights lesson plans and activities that help elementary students develop map skills as they learn earth science concepts.

Subject:
Earth and Space Systems
Geography
History/Social Sciences
Science
Material Type:
Lesson Plan
Provider:
Ohio State University College of Education and Human Ecology
Provider Set:
Beyond Penguins and Polar Bears: An Online Magazine for K-5 Teachers
Author:
Jessica Fries-Gaither
Date Added:
05/29/2019
Europe in the Middle Ages 500-1000 A.D. (C.E.): Predicting the Consequences of the Division of Charlemagne’s Empire
Conditional Remix & Share Permitted
CC BY-NC-SA
Rating
0.0 stars

The first of two lessons on territorial extent of empires in Europe in 814 at the end of Charlemagne’s rule and another after the death of Charlemagne. Students extend and refine their map interpretation skills by examining the use of color to denote territorial ownership. In addition, students make predictions about likely paths of invasion. Key questions: How do physical geography, cultural, economic, and political factors affect borders? To what extent does the physical environment define borders?

Subject:
Geography
History/Social Sciences
World History
Material Type:
Lesson
Visual Media
Provider:
Virginia Geographic Alliance
Provider Set:
World History and Geography to 1500 A.D. (C.E.) Class Lessons
Author:
Barbara
Donald J.
Georgeanne
Joseph D.
Rebecca
Shannon
Castelo
Crain
Enedy
Hribar
Mills
Zeigler
Date Added:
08/14/2012
From Colonialism to Tourism: Maps in American Culture
Unrestricted Use
CC BY
Rating
0.0 stars

From the earliest days of settlement and migration, the people of North America have relied on maps and mapping to understand their environment and place within it. Maps have helped Americans prospect investments, comprehend war, and plan leisure in places unknown. As Americans have used maps to explore the U.S., capitalize on its resources, and displace its Native peoples, maps have shaped American cultural ideas about travel, place, and ownership. This exhibit explores the cultural and historic impact of mapping through four specific moments in American history: migration along the Oregon Trail, the rise of the lumber industry, the Civil War, and the popularization of the automobile and individual tourism. It concludes with a look at maps in the age of computers, the Internet, and beyond. These moments demonstrate the influence maps have had over how Americans imagine, exploit, and interact with national geographies and local places. This exhibition was created as part of the DPLA’s Digital Curation Program by the following students in Professor Helene Williams's capstone course at the Information School at the University of Washington: Greg Bem, Kili Bergau, Emily Felt, and Jessica Blanchard. Additional revisions and selections made by Greg Bem.

Subject:
American History
Geography
History/Social Sciences
Material Type:
Primary Source
Unit of Study
Visual Media
Provider:
Digital Public Library of America
Author:
Emily Felt
Greg Bem
Jessica Blanchard
Kili Bergau
Date Added:
09/01/2014
Global Connections to Enhance and Inspire
Unrestricted Use
CC BY
Rating
0.0 stars

This lesson is similar to a "Mystery Skype" where two classes connect through a live video conferencing platform and provide critical thinking clues to determine the location of the other class. Once both locations have been identified, students can then ask additional questions to learn more about the culture, climate, language, and traditions of both classes.

Subject:
Geography
Material Type:
Lesson
Author:
Tamara Letter
Date Added:
02/28/2022
Instructional Plan: Where Am I?
Conditional Remix & Share Permitted
CC BY-NC
Rating
0.0 stars

Students will explore the creation, types and uses of maps, the process of map-making and cartography as a career. Students will create a personal map. 

Subject:
Fine Arts
Visual Art
Material Type:
Activity/Lab
Author:
VDOE Fine Arts
Date Added:
08/31/2022
Islamic Empires: Comparing the Extent of the Islamic Empires
Conditional Remix & Share Permitted
CC BY-NC-SA
Rating
0.0 stars

The second of two lessons on Islamic Empires, students examine maps showing the territorial extent of each of the three major Islamic Caliphates. This examination, showing the same territory through different time periods, provides a springboard for analyzing historical factors underlying the territorial changes. Students also explore cultural, economic, and political factors that account for the changing borders as they match explanations associated with the changes in the maps. Key questions: How did the borders of the Islamic Empires change through time? What cultural, economic, and political factors could account for the changing borders?

Subject:
Geography
History/Social Sciences
World History
Material Type:
Lesson
Visual Media
Provider:
Virginia Geographic Alliance
Provider Set:
World History and Geography to 1500 A.D. (C.E.) Class Lessons
Author:
Barbara
Donald J.
Georgeanne
Joseph D.
Rebecca
Shannon
Castelo
Crain
Enedy
Hribar
Mills
Zeigler
Date Added:
08/14/2012
The Last Great Race: Teaching the Iditarod
Conditional Remix & Share Permitted
CC BY-SA
Rating
0.0 stars

This article gives background information on the Iditarod race in Alaska and shows how the race can be used in Grades K-5 classrooms to incorporate science, geography and language arts. The author provides links to resources that involve reading expository tests and writing assignments as well as working with real-time data. The article appears in the free, online magazine Beyond Penguins and Polar Bears.

Subject:
Science
Scientific and Engineering Practices
Material Type:
Lesson Plan
Teaching/Learning Strategy
Provider:
Ohio State University College of Education and Human Ecology
Provider Set:
Beyond Penguins and Polar Bears: An Online Magazine for K-5 Teachers
Author:
Beyond Penguins and Polar Bears
Jessica Fries-Gaither
National Science Foundation
Date Added:
10/17/2011
The Longest Walk
Conditional Remix & Share Permitted
CC BY-NC-SA
Rating
0.0 stars

In this task students figure out how to draw the longest line on a map of the United States without hitting a border. They use color and line plots to keep track of their results.

Subject:
Mathematics
Material Type:
Activity/Lab
Provider:
Illustrative Mathematics
Author:
Illustrative Mathematics
Date Added:
05/01/2012
Mapping Local Geographies
Conditional Remix & Share Permitted
CC BY-NC-SA
Rating
0.0 stars

This resource provides links to a number of activities involving local mapping including autobiographical mapping known as a "turf map," how to get students to connections to their local geographies, mapping a school for teaching tolerance, use of historical maps of a community, and use of technology through Googe Earth. Ideas presented were mostly introduced in APHG Academies that have been sponsored by the VGA, NCGE meetings, AP Annual Conferences, workshops, and through collaboration with colleagues. This collection is intended to help get new teachers started or to move others to grow their curriculum and enhance the experiences of their students and build geographic skills by promoting the inclusion of local geographies into classrooms and through personal observation and data collection in local environments.

Subject:
Geography
History/Social Sciences
Virginia History
Material Type:
Teaching/Learning Strategy
Provider:
Virginia Geographic Alliance
Provider Set:
What Works in the Geography Classroom Series
Author:
Everhart, Mary L.
Date Added:
09/08/2012
Mapping the Glaciers
Conditional Remix & Share Permitted
CC BY-NC-SA
Rating
0.0 stars

This earth systems field lab begins with an in-class guided inquiry experience which uses Minnesota Geological Survey 3-D maps of the upper Midwest to determine where they believe glaciers may have had an influence. They will determine this by looking at landscapes and compiling their own evidence from the maps. They will also offer evidence for a hypothesis they generate which involves the direction that the glacier was traveling.

Subject:
Earth and Space Systems
Science
Material Type:
Activity/Lab
Provider:
Science Education Resource Center (SERC) at Carleton College
Provider Set:
Pedagogy in Action
Author:
Cathy Oates-Bockenstedt
Date Added:
05/29/2019
Nautical Navigation
Read the Fine Print
Educational Use
Rating
0.0 stars

In this activity, students explore the importance of charts to navigation on bodies of water. Using one worksheet, students learn to read the major map features found on a real nautical chart. Using another worksheet, students draw their own nautical chart using the symbols and identifying information learned.

Subject:
Science
Scientific and Engineering Practices
Material Type:
Activity/Lab
Provider:
TeachEngineering
Provider Set:
TeachEngineering
Author:
Denise Carlson
Janet Yowell
Malinda Schaefer Zarske
Matt Lippis
Penny Axelrad
Date Added:
10/14/2015
PAGE ACSE - Community Map Skills for Kindergarten
Conditional Remix & Share Permitted
CC BY-NC-SA
Rating
0.0 stars

This activity supports student knowledge of community and story telling.  Students also build map skills and coding skills as they use the robot to act out the story.  Basic block coding skills can be taught as part of the lesson or prior to the lesson. 

Subject:
Algorithms and Programming
Computer Science
Cross-Curricular
Geography
History/Social Sciences
Matter
STEM/STEAM
Science
Material Type:
Activity/Lab
Lesson
Lesson Plan
Author:
Tracy Shifflett
Date Added:
10/26/2023
Spanish CS Integrated ESTAR with Location Lesson Plan
Conditional Remix & Share Permitted
CC BY-NC
Rating
0.0 stars

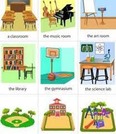
The Big Idea: Kinesthetic learning incorporating programming and language instructionConcept: Programming Bee-Bot while learning school vocabulary and the verb ESTARContext: Students will use the Bee-Bot School Map to talk about the location of various places in the school building and area in Spanish. 

Subject:
Algorithms and Programming
Bilingual Education
Computer Science
Dual Immersion (Languages)
English Language Development (ELD)
Spanish
World Languages
Material Type:
Activity/Lab
Game
Interactive
Lesson
Lesson Plan
Author:
Ada Chrisman
Date Added:
12/15/2022
Student Created Landform Maps with Glacial Emphasis
Conditional Remix & Share Permitted
CC BY-NC-SA
Rating
0.0 stars

Students learn glacial landforms and create a landform map including a location grid (eg. position A2) and map key.

Subject:
Earth and Space Systems
Science
Material Type:
Activity/Lab
Lesson Plan
Provider:
Science Education Resource Center (SERC) at Carleton College
Provider Set:
Pedagogy in Action
Author:
Carlyn Wilson
Date Added:
05/29/2019
This Land Is Your Land, This Land Is My Land
Read the Fine Print
Educational Use
Rating
0.0 stars

In this activity, students will review and evaluate the ways land is covered and used in their local community. They will also consider the environmental effects of the different types of land use. Students will act as community planning engineers to determine where to place a new structure that will have the least effect on the environment.

Subject:
Science
Scientific and Engineering Practices
Material Type:
Activity/Lab
Provider:
TeachEngineering
Provider Set:
TeachEngineering
Author:
Amy Kolenbrander
Janet Yowell
Jessica Todd
Malinda Schaefer Zarske
Date Added:
10/14/2015
Torn in Two: Mapping the American Civil War
Unrestricted Use
CC BY
Rating
0.0 stars

The Civil War, from 1861 to 1865, is the centerpiece of our nation's story. It looms large, not merely because of its brutality and scope but because of its place in the course of American history. The seeds of war were planted long before 1861 and the conflict remains part of our national memory. Geography has helped shape this narrative. The physical landscape influenced economic differences between the regions, the desire to expand into new territories, the execution of the conflict both in the field and on the home front, and the ways in which our recollections have been shaped. Maps enable us to present the complex strands that, when woven together, provide a detailed account of the causes and conduct of the war. These visual images remain a salient aspect of our memory. Photographs, prints, diaries, songs and letters enhance our ability to tell this story, when our nation, as a Currier & Ives cartoon depicts, was about to be "Torn in Two." This exhibition tells the story of the American Civil War both nationally and locally in Boston, Massachusetts, through maps, documents, letters, and other primary sources. This exhibition was developed by the Norman B. Leventhal Map Center, a nonprofit organization established as a partnership between the Boston Public Library and philanthropist Norman Leventhal.

Subject:
American History
Geography
History/Social Sciences
Material Type:
Primary Source
Unit of Study
Visual Media
Provider:
Digital Public Library of America
Date Added:
05/01/2015
Visualizing Geospatial Data
Conditional Remix & Share Permitted
CC BY-NC-SA
Rating
0.0 stars

This activity will ask students to locate geographic regions and features on a class map using longitude and latitude measurements. Using the longitude and latitude data, students will be able to visualize geographic features in the actual location in order to analyze the living conditions of various regions.This material is based upon work supported by the National Science Foundation under Grant No. 2010256.Any opinions, findings, and conclusions or recommendations expressed in this material are those of the author(s) and do not necessarily reflect the views of the National Science Foundation.

Subject:
American History
Computer Science
Data and Analysis
Material Type:
Lesson
Lesson Plan
Author:
CodeVA Curriculum
Date Added:
11/18/2022
Where Does the Arctic Begin? End?
Conditional Remix & Share Permitted
CC BY-SA
Rating
0.0 stars

This article points out that there is no one official definition for the Arctic. Then the author identifies definitions ranging from geography to climate to culture and more. Maps and other visuals illustrate the definitions. The author suggests that defining the Arctic can be an example for K-Grade 5 students of the nature and challenges of classification systems. The article appears in the free, online magazine Beyond Penguins and Polar Bears.

Subject:
Science
Scientific and Engineering Practices
Material Type:
Homework/Assignment
Lecture
Student Guide
Provider:
Ohio State University College of Education and Human Ecology
Provider Set:
Beyond Penguins and Polar Bears: An Online Magazine for K-5 Teachers
Author:
Beyond Penguins and Polar Bears
Jessica Fries-Gaither
National Science Foundation
Date Added:
10/17/2011