Friction is the amount of force or resistance acting on an object. …
Friction is the amount of force or resistance acting on an object. Without friction driving or riding in vehicles would look extremely different and practically impossible. Scientists and engineers alike must collect data and information to draw conclusions after much analysis to determine the rate of friction acting on objects. In this activity students will collect and analyze data using excel sheets and create a line graph using the provided excel or google sheets program.
Investigating forms of data collectionMathematics Instructional Plans (MIPs) help teachers align instruction …
Investigating forms of data collectionMathematics Instructional Plans (MIPs) help teachers align instruction with the 2016 Mathematics Standards of Learning (SOL) by providing examples of how the knowledge, skills and processes found in the SOL and curriculum framework can be presented to students in the classroom.
Students are to research a topic and present the topic by either …
Students are to research a topic and present the topic by either trying to convince you one way or another about the topic or leaving you to make your choice.
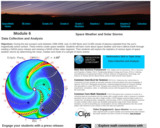
During the last sunspot cycle between 1996-2008, over 21,000 flares and 13,000 …
During the last sunspot cycle between 1996-2008, over 21,000 flares and 13,000 clouds of plasma exploded from the Sun's magnetically active surface. These events create space weather. Students will learn more about space weather and how it affects Earth through reading a NASA press release and viewing a NASA eClips video segment. Then students will explore the statistics of various types of space weather storms by determining the mean, median and mode of a sample of storm events. This activity is part of the Space Math multimedia modules that integrate NASA press releases, NASA archival video, and mathematics problems targeted at specific math standards commonly encountered in middle school textbooks. The modules cover specific math topics at multiple levels of difficulty with real-world data and use the 5E instructional sequence.
The student will use a table of personal data collected about plugged/unplugged …
The student will use a table of personal data collected about plugged/unplugged activites and times of rest throughout the period of one week (7 days) to document screen times in comparison to active and restful breaks for a computer science integration and digital balance project.This Part 1 activity uses the data collected in a table to teach students how to copy and paste a table from Docs into Slides, and how to develop a Slideshow Presentation with tables (Part 1) and graphs (Part 2). Students are given opportunities to collect and analyze data, to enter information into tables and graphs, to develop and share presentations in Slides, as well as summarize and draw conclusions about the data collection, graphing, and results as comparable to their peers, digital categories, or peer groups (Gamers vs YouTubers, Boys vs Girls, etc.).The goal/s of this unit is to help students realize the importance of living a digitally balanced life and to help students develop skills for creating and using digital tables and graphs with an introduction to data collection and analysis.
The student will use previously collected personal and peer data (Part 1: …
The student will use previously collected personal and peer data (Part 1: Screen Time Logs) to graph a bar and pie graph in Slides using Sheets to graph the data collected.This is the second part of an intended presentation project for a computer CTE middle school class, but can be edited and adapted for any graphing and/or computer integration lessons about bar and pie graphs and how to make them in Google Sheets using Google Slides.
When school teams use varied data points in conjunction with one another …
When school teams use varied data points in conjunction with one another the information can lead to more effective systems, structures and interventions that will ultimately lead to improved outcomes for students. Teams are encouraged to consider using the Data-Informed Decision-Making Tool and Five Whys when analyzing their data and determining next steps.
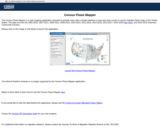
The Census Flows Mapper is a web mapping application intended to provide …
The Census Flows Mapper is a web mapping application intended to provide users with a simple interface to view, save and print county-to-county migration flows maps of the United States. The data are from the 2006-2010 American Community Survey.
Exploring data collection and graphing -- Mathematics Instructional Plans (MIPs) help teachers align …
Exploring data collection and graphing -- Mathematics Instructional Plans (MIPs) help teachers align instruction with the 2016 Mathematics Standards of Learning (SOL) by providing examples of how the knowledge, skills and processes found in the SOL and curriculum framework can be presented to students in the classroom.
Modeling Data Using an Appropriate FunctionMathematics Instructional Plans (MIPs) help teachers align …
Modeling Data Using an Appropriate FunctionMathematics Instructional Plans (MIPs) help teachers align instruction with the 2016 Mathematics Standards of Learning (SOL) by providing examples of how the knowledge, skills and processes found in the SOL and curriculum framework can be presented to students in the classroom.
When designing programs or completing projects, students should consider what types of …
When designing programs or completing projects, students should consider what types of data might be used as input, how the data is to be stored and processed, and the output that meets the specific needs of the user. The collection and exchanging of data is used throughout the programming process. Both hardware and software components are critical to the collection and exchange of data. In this lesson, students will design a project to collect data involving rates. Students will input their data into a Google Sheet (software) using a computer (hardware). Students will store the data on the sheet and complete a ratio table involving the unit rate.
The mission of the Data Resource Center for Child and Adolescent Health …
The mission of the Data Resource Center for Child and Adolescent Health (DRC) is to advance the effective use of public data on the status of children’s health and health-related services for children, youth and families in the United States. The DRC does this by providing hands-on access to national, state, and regional data findings from large population-based surveys. Data are collected from parents and thus contribute a much needed voice in the drive to improve the quality of health care for children and youth.
Data Science is a growing field across all disciplines and grade levels. …
Data Science is a growing field across all disciplines and grade levels. Use the assets in this collection to help learn valuable skills and concepts related to collecting, using, analyzing, and presenting data. The VDOE, Data Science Teachers, and WHRO Education collaboratively created this content.
This crossword activity will help students better understand the different types of …
This crossword activity will help students better understand the different types of storage options available for a computer to store and manage files.
Students will research one of the seven federally recognized tribes of Native …
Students will research one of the seven federally recognized tribes of Native Americans in Virginia to identify local features of the land, their language, the region of Virginia where they originally lived, where the tribal lands are today, and how they interacted with their environment. From this research, the student groups will design a visualization of this data using a poster, online design tool, or a presentation. Student groups will present their information to each other, and the classroom will design a chart to find similarities and differences between the tribes.
This activity allows for students to Identify the quantitative and qualitative benefits of …
This activity allows for students to Identify the quantitative and qualitative benefits of going to collegeUnderstand common costs associated with collegeExplain the difference between sticker price and net price
Overview of the activity:The students will sort and graph the items given …
Overview of the activity:The students will sort and graph the items given to them and discuss the way they are sorted. They will then complete a graph of the items, and then we will construct and build with the items and explain what they build and how tall it is.
No restrictions on your remixing, redistributing, or making derivative works. Give credit to the author, as required.
Your remixing, redistributing, or making derivatives works comes with some restrictions, including how it is shared.
Your redistributing comes with some restrictions. Do not remix or make derivative works.
Most restrictive license type. Prohibits most uses, sharing, and any changes.
Copyrighted materials, available under Fair Use and the TEACH Act for US-based educators, or other custom arrangements. Go to the resource provider to see their individual restrictions.