The Progressive era is typically taught as through the lens that people …
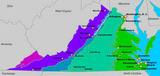
The Progressive era is typically taught as through the lens that people shaped their world in response to the societal problems that came along with the eras of industrialization, urbanization and mass immigration to the United States. This lesson is taught through the lens that geography also shaped reform. Impacts of geography include the growth of Chicago due to its relative location as an intermediary between cattle drives and east coast cities, labor reform including building safety and the geography of buildings and fire exits, and conservative efforts such as the National Parks. This lesson is not meant to teach the entirety of the Progressive era, but a few specific points that were impacted by geography. Contains links to student materials and teacher materials for creating lesson plans.
Demonstrate how to draw a landscape outline using foreground, middle ground and …
Demonstrate how to draw a landscape outline using foreground, middle ground and background. Tell the students that they will need to choose two different VA landscapes to draw including details and color.Draw an outline in pencil of the first regional landscape of your choice.Discuss colored pencil techniques. When coloring in your drawings, use several different colors and shades of a color as well as how to vary the pressure on your pencil to add depth to your drawing. Have students pass out supplies.Students write what two regions of their choice on the back of their first landscape drawing. Students work independently on their first landscape.
Students will participate in an online scavenger hunt based on a story …
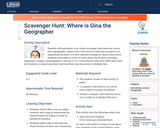
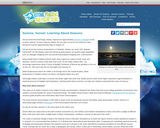
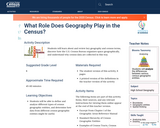
Students will participate in an online scavenger hunt based on a story that a geographer named Gina, who loves to travel, has escaped to an undisclosed location. It is their mission to bring her back to the school. Students must follow a series of clues about the location including landmarks, weather, and population,and use a U.S. Census Bureau data tool called State Facts for Students to answer questions that lead them one step closer to finding Gina.
Place and Location are two of the five themes of geography and …
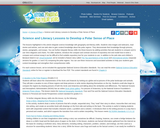
Place and Location are two of the five themes of geography and a natural starting point for a study of the Arctic and Antarctica. Location answers the question, "Where am I?" while the study of place asks, "What kind of a place is it?" and, "How does this place connect to my hometown?" This issue of Beyond Penguins and Polar Bears examines how you can introduce the Arctic and Antarctica and use science, geography, literacy, and technology to help your students compare and contrast these two dramatically different areas as well as their own home. Get ready for an adventure as you and your students develop your polar sense of place!
Beyond Penguins and Polar Bears is an online professional development magazine for elementary teachers which focuses on preparing teachers to teach polar science concepts in an already congested curriculum by integrating inquiry-based science with literacy teaching. Such an integrated approach can increase students' science knowledge, academic language, reading comprehension, and written and oral discourse abilities.
This issue of the free online magazine, Beyond Penguins and Polar Bears, …
This issue of the free online magazine, Beyond Penguins and Polar Bears, examines how elementary teachers can introduce the Arctic and Antarctica and use science, geography, literacy, and technology to help students compare and contrast these two dramatically different areas as well as their own home.
Beginning with examples from the polar regions, this article examines the question …
Beginning with examples from the polar regions, this article examines the question Why do we have seasons? Included are links to lesson plans, a list of childrenČs books, and suggested alignments with science, literacy, geography, and climate instruction in K-5 classrooms. The article appears in the free, online magazine Beyond Penguins and Polar Bears.
This lesson will provide information about the impact technology has on human …
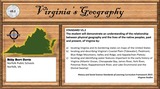
This lesson will provide information about the impact technology has on human activities and lifestyle. It should provide students with an understanding of how the traditional impact of the environment on humans is altered in today’s society by technological advances which allow humans to live beyond the limitations of the environment. Students will brainstorm and provide prior knowledge to lead discussion while the teacher will respond to student input by correcting and adding information as needed. Students will also draw plans for a city and indicate how technology will improve life for the residents.
Students participate in a JiTT activity to read the front pages of …
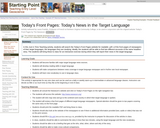
Students participate in a JiTT activity to read the front pages of two target language newspapers and to report the content to their classmates in the target language. When this exercise is done on a regular basis, it can result in increasing vocabulary and speech fluency.
The Civil War, from 1861 to 1865, is the centerpiece of our …
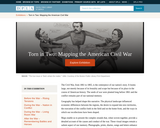
The Civil War, from 1861 to 1865, is the centerpiece of our nation's story. It looms large, not merely because of its brutality and scope but because of its place in the course of American history. The seeds of war were planted long before 1861 and the conflict remains part of our national memory. Geography has helped shape this narrative. The physical landscape influenced economic differences between the regions, the desire to expand into new territories, the execution of the conflict both in the field and on the home front, and the ways in which our recollections have been shaped. Maps enable us to present the complex strands that, when woven together, provide a detailed account of the causes and conduct of the war. These visual images remain a salient aspect of our memory. Photographs, prints, diaries, songs and letters enhance our ability to tell this story, when our nation, as a Currier & Ives cartoon depicts, was about to be "Torn in Two." This exhibition tells the story of the American Civil War both nationally and locally in Boston, Massachusetts, through maps, documents, letters, and other primary sources. This exhibition was developed by the Norman B. Leventhal Map Center, a nonprofit organization established as a partnership between the Boston Public Library and philanthropist Norman Leventhal.
This activity will ask students to locate geographic regions and features on …
This activity will ask students to locate geographic regions and features on a class map using longitude and latitude measurements. Using the longitude and latitude data, students will be able to visualize geographic features in the actual location in order to analyze the living conditions of various regions.This material is based upon work supported by the National Science Foundation under Grant No. 2010256.Any opinions, findings, and conclusions or recommendations expressed in this material are those of the author(s) and do not necessarily reflect the views of the National Science Foundation.
Students learn about floods, discovering that different types of floods occur from …
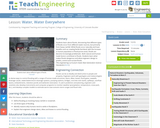
Students learn about floods, discovering that different types of floods occur from different water sources, but primarily from heavy rainfall. While floods occur naturally and have benefits such as creating fertile farmland, students learn that with the increase in human population in flood-prone areas, floods are become increasingly problematic. Both natural and manmade factors contribute to floods. Students learn what makes floods dangerous and what engineers design to predict, control and survive floods.
Students will learn about and review key geography and census terms, discover …
Students will learn about and review key geography and census terms, discover how the U.S. Census Bureau organizes space geographically, and understand why census data are collected in this way.
SSAC Physical Volcanology module. Students build a spreadsheet to estimate the volume …
SSAC Physical Volcanology module. Students build a spreadsheet to estimate the volume of volcanic deposits using map, thickness and high-water mark data from the 2005 Panabaj debris flow (Guatemala).
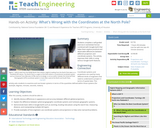
Students complete a self-guided exercise in worksheet format combined with Google Earth …
Students complete a self-guided exercise in worksheet format combined with Google Earth that helps them explore practical and observable differences between different projection and coordinate systems. The activity improves their skills in using various Google Earth features.
Students will apply their knowledge of the characteristics of the five major …
Students will apply their knowledge of the characteristics of the five major regions to create if-statements. As a warm-up students will complete a table using IF statements.During student-facing project, students will:Create 2-3 additional variables within the conditions chart that will direct the flow to determine the correct region.Record responses provided by their partner on an excel spreadsheet.Students will use responses provided to draw a conclusion of which region their partner is “located”.
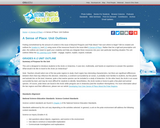
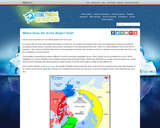
This article points out that there is no one official definition for …
This article points out that there is no one official definition for the Arctic. Then the author identifies definitions ranging from geography to climate to culture and more. Maps and other visuals illustrate the definitions. The author suggests that defining the Arctic can be an example for K-Grade 5 students of the nature and challenges of classification systems. The article appears in the free, online magazine Beyond Penguins and Polar Bears.
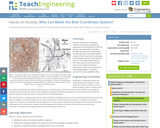
Students learn about coordinate systems in general by considering questions concerning what …
Students learn about coordinate systems in general by considering questions concerning what it is that the systems are expected do, and who decided how they look. They attempt to make their own coordinate systems using a common area across all groups and compete to see who can make the best one. Then they analyze why it is that some systems work better than others and consider what those observations mean for evaluating and choosing geographic coordinate systems commonly available today.
No restrictions on your remixing, redistributing, or making derivative works. Give credit to the author, as required.
Your remixing, redistributing, or making derivatives works comes with some restrictions, including how it is shared.
Your redistributing comes with some restrictions. Do not remix or make derivative works.
Most restrictive license type. Prohibits most uses, sharing, and any changes.
Copyrighted materials, available under Fair Use and the TEACH Act for US-based educators, or other custom arrangements. Go to the resource provider to see their individual restrictions.