This is a google slides mini lesson on finding the mean of …
This is a google slides mini lesson on finding the mean of a set of data. The first slide consists of a definition of mean. Students will solve what the mean is and make a text box and type the answer init, then complete the slides.
This is a google slides mini lesson on finding the median of …
This is a google slides mini lesson on finding the median of a set of data. The first slide consists of a definition of median. Students will solve what the median is and make a text box and type the answer. Then, they will complete all slides.
This is a google slides mini lesson on finding the range of …
This is a google slides mini lesson on finding the range of a set of data. The first slide consists of the definition of range. Students will solve what a range is and will make a text box and type the answer in it, then complete the slides.
This learning video presents an introduction to the Flaws of Averages using …
This learning video presents an introduction to the Flaws of Averages using three exciting examples: the ''crossing of the river'' example, the ''cookie'' example, and the ''dance class'' example. Averages are often worthwhile representations of a set of data by a single descriptive number. The objective of this module, however, is to simply point out a few pitfalls that could arise if one is not attentive to details when calculating and interpreting averages. The essential prerequisite knowledge for this video lesson is the ability to calculate an average from a set of numbers. During this video lesson, students will learn about three flaws of averages: (1) The average is not always a good description of the actual situation, (2) The function of the average is not always the same as the average of the function, and (3) The average depends on your perspective. To convey these concepts, the students are presented with the three real world examples mentioned above.
In this open-ended, hands-on activity that provides practice in engineering data analysis, …
In this open-ended, hands-on activity that provides practice in engineering data analysis, students are given gait signature metric (GSM) data for known people types (adults and children). Working in teams, they analyze the data and develop models that they believe represent the data. They test their models against similar, but unknown (to the students) data to see how accurate their models are in predicting adult vs. child human subjects given known GSM data. They manipulate and graph data in Excel® to conduct their analyses.
This video is part of the Learn and Grow with WHRO TV …
This video is part of the Learn and Grow with WHRO TV series. Watch Xenia Clare teach about interpreting and analyzing data on a bar graph and pictograph.
Students will analyze census data and graphs that demonstrate how certain aspects …
Students will analyze census data and graphs that demonstrate how certain aspects of the lives of African-Americans have changed since civil rights leader Martin Luther King Jr. delivered his "I Have a Dream" speech in 1963. Students will select a fact from these data, facts from other sources, and a historical photograph to include on a poster about King.
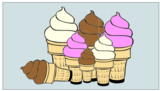
This is a data collection, prediction, and graphing activity using three flavors …
This is a data collection, prediction, and graphing activity using three flavors of ice cream as the subject. It is a ready-made lesson with a Google Slideshow that has all of the activities built into it.
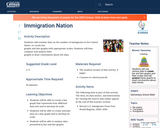
Students will examine data on the number of immigrants in the United …
Students will examine data on the number of immigrants in the United States, to create bar graphs and line graphs with appropriate scales. Students will then compare and analyze their graphs to draw conclusions about the data.
Welcome to Information Systems for Business and Beyond. In this book, you …
Welcome to Information Systems for Business and Beyond. In this book, you will be introduced to the concept of information systems, their use in business, and the larger impact they are having on our world.
This book is written as an introductory text, meant for those with little or no experience with computers or information systems. While sometimes the descriptions can get a little bit technical, every effort has been made to convey the information essential to understanding a topic while not getting bogged down in detailed terminology or esoteric discussions.
Learning objectives can be found at the beginning of each chapter. Of course, all chapters are recommended for use in an introductory information systems course. However, for courses on a shorter calendar or courses using additional textbooks, a review of the learning objectives will help determine which chapters can be omitted.
At the end of each chapter, there is a set of study questions and exercises (except for chapter 1, which only offers study questions). The study questions can be assigned to help focus students’ reading on the learning objectives. The exercises are meant to be a more in-depth, experiential way for students to learn chapter topics. It is recommended that you review any exercise before assigning it, adding any detail needed (such as length, due date) to complete the assignment.
This article discusses how the study of weather can meet the NCTM …
This article discusses how the study of weather can meet the NCTM Data Analysis and Probability standard. Links to lessons for grades K-2 and 3-5 are provided.
An online technical assistance and distance learning effort covering all aspects of …
An online technical assistance and distance learning effort covering all aspects of curation -- caring for archaeological collections such as objects, records, reports, and digital data -- wherever they may be (in the field, the archeologist's office, the lab, or a repository).
This course was originally developed for the Open Course Library project. The …
This course was originally developed for the Open Course Library project. The text used is Math in Society, edited by David Lippman, Pierce College Ft Steilacoom. Development of this book was supported, in part, by the Transition Math Project and the Open Course Library Project. Topics covered in the course include problem solving, voting theory, graph theory, growth models, finance, data collection and description, and probability.
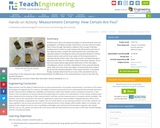
Students learn about the statistical analysis of measurements and error propagation, reviewing …
Students learn about the statistical analysis of measurements and error propagation, reviewing concepts of precision, accuracy and error types. This is done through calculations related to the concept of density. Students work in teams to each measure the dimensions and mass of five identical cubes, compile the measurements into small data sets, calculate statistics including the mean and standard deviation of these measurements, and use the mean values of the measurements to calculate density of the cubes. Then they use this calculated density to determine the mass of a new object made of the same material. This is done by measuring the appropriate dimensions of the new object, calculating its volume, and then calculating its mass using the density value. Next, the mass of the new object is measured by each student group and the standard deviation of the measurements is calculated. Finally, students determine the accuracy of the calculated mass by comparing it to the measured mass, determining whether the difference in the measurements is more or less than the standard deviation.
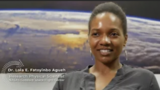
Video Description: In this close-up video, Dr. Lola Fatoyinbo Agueh, a Research Physical …
Video Description: In this close-up video, Dr. Lola Fatoyinbo Agueh, a Research Physical Scientist at NASA's Goddard Space Flight Center, shares her love for exploring new places and passion for studying Earth, from the ground to satellite imagery. Video Length: 1:51NASA eClipsTM is a suite of online student-centered, standards-based resources that support instruction by increasing STEM literacy in formal and nonformal settings. These free digital and downloadable resources inform and engage students through NASA-inspired, real-world connections.NASA eClips Ask SME: Close-up with a NASA Subject Matter Expert videos are professionally developed to capture a glimpse of NASA SME's personal interests and career journeys. Each can be used to spark student interest and broaden their ideas of the STEM workforce. Additional videos in this series can be found by searching GoOpenVA using "NASA eClips Ask SME".
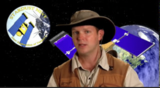
Video Description: Visit a lab at NASA's Johnson Space Center where scientists study …
Video Description: Visit a lab at NASA's Johnson Space Center where scientists study meteorites. Learn how aerogel, the lightest material in the world helped capture pieces of a comet and return the comet dust to Earth. See what scientists can learn about our universe from these tiny particles. Video Length: 6:35.NASA eClips is a suite of online student-centered, standards-based resources that support instruction by increasing STEM literacy in formal and nonformal settings. These free digital and downloadable resources inform and engage students, through NASA-inspired, real-world connections.NASA eClips Our World videos (grades 3-5) help students understand the differences between science (the natural world) and engineering (the designed world). These video segments supplement elementary learning objectives not only in science, technology, engineering and mathematics, but also in reading, writing, visual and performing arts.
No restrictions on your remixing, redistributing, or making derivative works. Give credit to the author, as required.
Your remixing, redistributing, or making derivatives works comes with some restrictions, including how it is shared.
Your redistributing comes with some restrictions. Do not remix or make derivative works.
Most restrictive license type. Prohibits most uses, sharing, and any changes.
Copyrighted materials, available under Fair Use and the TEACH Act for US-based educators, or other custom arrangements. Go to the resource provider to see their individual restrictions.